
Research Area : Design and Analysis of Environmental Survey and Experiments


Visualization of spatio-temporal information and structural analysis by Echelon tree structure
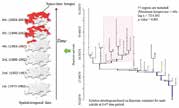
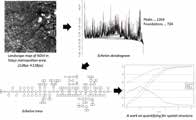 In recent years, the analysis target of statistical science has become complicated, especially in spatial data, it is necessary to analyze the data with time series and multi-dimension in addition to usual fixed time and space situation. Furthermore, the amount number of data has been increasing. For these complicated and large-scale spatial data, we will develop the hierarchically representational approaches based on “Echelon analysis” by using the geographical and temporal positional information of each region. The echelon provides a dendrogram representation of the surface topology of graphtheoretic analysis and surface structure comparison. The echelon dendrogram is a powerful tool that expresses a unified framework to handle lattice data with visualization.
Detection of spatial cluster for large scale spatial data
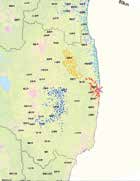
The detection of problems such as the generation status of infective diseases or hazard maps of natural disasters is very basic and important. Some powerful and useful tools such as geographical information systems (GISs) are available, but it is very difficult to determine the location of space-time clusters for various types of spatial data in large quantities or with large time series. The aim of this study is to establish methods to identify a disease cluster or a contaminant cluster, so-called hotspot, for various kinds of spatio-temporal spatial data and to develop software for that.
Research Area : Design and Analysis of Environmental Survey and Experiments


Some applications in multivariate methods with alternating least squares
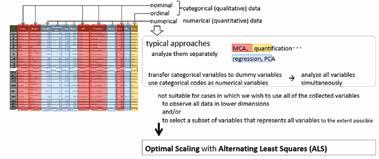 In recent years, we can obtain a huge data which have quantitative and qualitative variable. We call this type of data as mixed measurement levels data. The alternating least squares (ALS) algorithm is a most popular iterative computational method for mixed measurement levels data. The ALS algorithm alternates between the optimal scaling step and the parameter estimation step. The optimal scaling step is to obtain optimal scaled data by quantifying nominal and ordinal scaled data. The parameter estimation step is to compute parameters for the optimal scaled data. However, the drawback of the ALS algorithm is that its convergence is linear and very slow for very large data with mixed measurement levels.
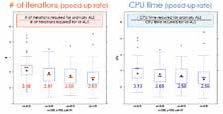 In order to circumvent the problem of slow convergence of the ALS algorithm, we provide an acceleration algorithm. The algorithm converges faster than the original sequence of ALS iterations.